


TradeFutures Ltd


© Lorem ipsum dolor sit Nulla in mollit pariatur in, est ut dolor eu eiusmod lorem 2012


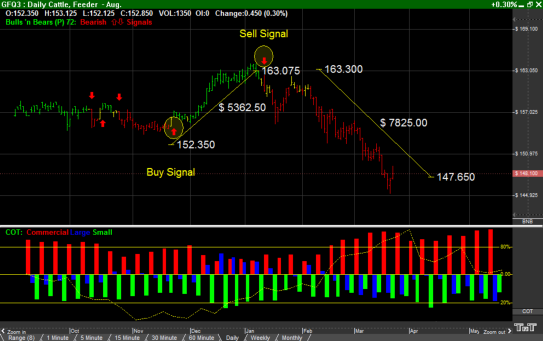
An Amazing Recent
Trade In Feeder Cattle
 The following trend down, was
approximately three months long,
and with an initial investment
amount of only $2,430, we would
have profited approximately $7,825.*
The following trend down, was
approximately three months long,
and with an initial investment
amount of only $2,430, we would
have profited approximately $7,825.*

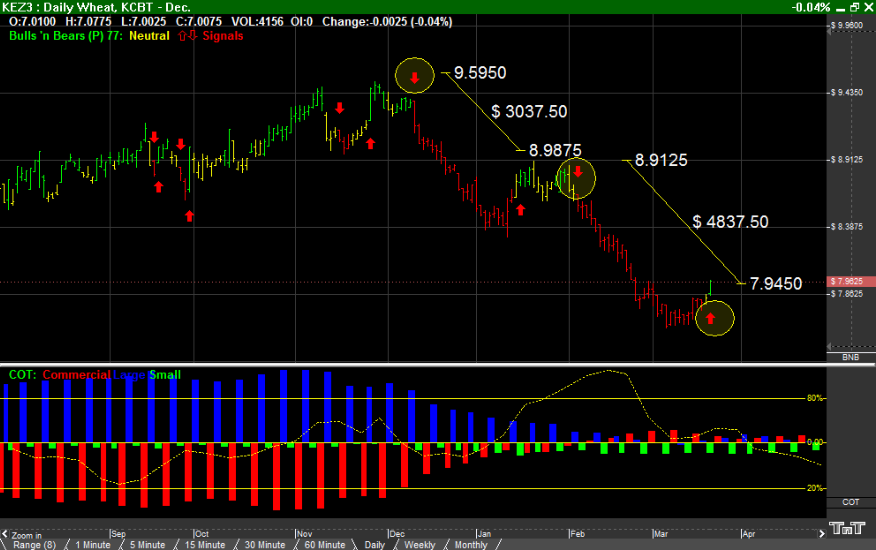
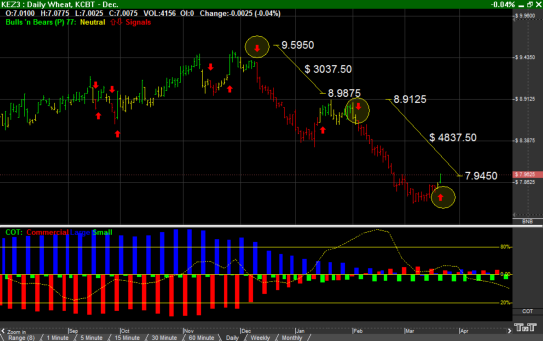
Look At These Trends
In Kansas City Wheat!
Had we taken a short position from
the first indicated downtrend in
Kansas City Wheat, the initial
margin amount to enter this trade
would have been $3,125, and less
than two months later, our profit on
this trade would have been
approximately $3,000. almost
double...that’s almost a 100% profit
in less than two months.
Again, this kind of profit potential is
what makes the Futures market so
attractive to investors.*

*Risk Disclosure: Trading security futures contract may not be suitable for all investors. You may lose a substantial amount of money in a very short period of time. The amount you may
lose is potentially unlimited and can exceed the amount you originally deposit with your broker. This is because futures’ trading is highly leveraged, with a relatively small amount of
money used to establish a position in assets that have a much greater value. If you are uncomfortable with this level of risk, you should not trade security futures contracts.
Copyright © All rights reserved : Trade Futures Ltd.
www.TradeFutures.co.uk

Commodity Trading Advisors & Management Consultants
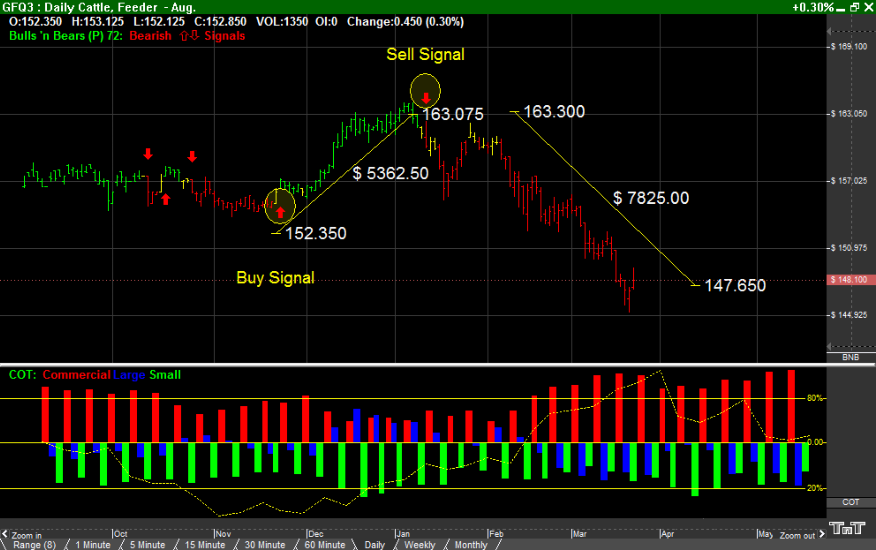
Potential Profits
What Is The Profits Potential When Trading Commodities?
In this chart example, you can see that the Bullish trend lasted about two months, and with an
initial margin amount investment of $2,430, this trade would have been profitable of
approximately $5,360.*
The following trend down, was approximately three months long, and with the same initial
investment amount, we would have profited approximately $7,825.*
In this chart example, you can see that that we had two strong Bearish trends, one right after
the other. Had we taken a short position from the first indicated downtrend, the initial margin
amount to enter this trade would have been $3,125, and less than two months later, our profit
on this trade would have been approximately $3,000. almost double...that’s 100% profit in less
than two months.*
On the second opportunity, had we shorted the Kansas City Wheat market, using the same
margin amount as listed above, $3,125, we would have experienced an approximate profit of
$4,837 in less than two months time...again, a profit of over 150%, and that’s why we love
trading the futures market.*
Hypothetical Results Disclaimer:
No representation is being made that any account will or is likely to achieve profits or losses
similar to those discussed within this site, support and texts. If you decide to invest real money,
all trading decisions should be your own. Hypothetical or simulated performance results have
certain limitations. Unlike an actual performance record, simulated results do not represent
actual trading. Furthermore, since the trades have not been executed, the results may have
under or over compensated for the impact, if any, of certain market factors, such as lack of
liquidity. Simulated trading programs in general are also subject to the fact that they are
designed with the benefit of hindsight. All illustrations in this website are for informational
purpose to show the principles behind having a good trading plan in order to minimize any losses
and maximize potential profits.
The illustrations below are not recommendations to buy or sell but to highlight the principles
behind the Track n Trade Live Trading and Charting Software.
The following examples are screen shots from the Track n Trade software that indicates how
much profit you could have made in various commodities if you were on the correct side. Track n
Trade has a number of indicators that automatically places buy and sell signals. Traders have a
preference and often restrict this to two or three such as moving averages, MACD, %R,
Commitment of Traders Report etc.
“ If you would not be
forgotten, as soon as you
are dead and rotten, write
things worthy reading or
do things worth the
writing"
-- Benjamin Franklin