


TradeFutures Ltd


© Lorem ipsum dolor sit Nulla in mollit pariatur in, est ut dolor eu eiusmod lorem 2012

The Power Of The COT
Commitment of Traders Report:
Follow The Commercials, by Sam Bhugaloo
One of the important features of the futures markets is the relationship between hedgers and speculators. Commercial traders are hedgers in the futures markets, while speculators are non-commercial traders. The Commodity Futures Trading Commission (CFTC), the government regulatory authority for the industry registers all futures contracts. The cost for registering contracts is higher for speculators than for hedgers. Thus, those traders who are producing or processing large amounts of commodities they are trading register as commercial traders. All other traders are either large non-commercials with many contracts traded at a time or traders with only a few contracts. The Commitment of Traders (COT) report is a powerful tool that if used correctly will allow traders to predict potential bullish trends or market tops by examining extreme levels of bullishness or bearishness. There are many traders who follow the large speculators and this may not necessarily produce the expected results. Let me explain why you should follow the COT commercials and incorporate this into your trading plan. What is the COT Report? The CFTC assembles a list of the contracts registered every day by each trader category in about 75 markets and publishes them every week on the internet at www.cftc.gov . This report, the Commitment of Traders (COT) includes the open interest for commercial buyers and sellers, large non-commercial buyers and sellers, and small buyers and sellers. From these reports it is possible to see how many contracts the commercial buyers and sellers are holding – the big guys, our trend follower. The COT reports provide a breakdown of each Tuesday's open interest for markets in which 20 or more traders hold positions equal to or above the reporting levels set up by the CFTC. Every Friday at 15:30 pm Eastern Time, the CFTC releases the reports on their website. Commercial Hedgers – institutions and individuals who manage the cash side of the business in the underlying commodity, like farmers, miners, international businesses and processors. Commercials are free from position limits. Non-Commercials (Large Speculators) – This is typically a large floor trader, a managed futures account, or a small hedge fund. In general, these types of traders are technically trend followers. Since the large speculators are consistent trend followers and usually overdo it at extremes, we want to follow their movements with caution as they are usually wrong. Small Speculators – This includes all speculators with positions below reportable limits and small hedgers. The data is about a week late when we receive it and this is a serious drawback in using it. Many traders have placed much importance on the numbers. Depending on which school of thought you belong to, some traders will follow the large traders, others will follow the commercials and a minority the small speculators. I will explain through a series of examples later why I follow the commercials. When prices go up, speculators want to buy more contracts and producers want to sell more of what they are trading. This is an important law of the world we live in. When prices go down, speculators want to sell more contracts and processors want to buy more of what they are trading. Analyse the mind-set of the speculator who is trying to make money from the current downtrend; his bet is it will continue, so he sells short in the hope that prices will go down more and profits will increase. The commercials on the other hand are not trying (almost always) to make money from what the market is doing, but rather from the current of the market or commodity. If the commercials see a price that is lower than they have been paying, they will often buy because the cost of the product they make with the commodity is lower. Therefore the mark up is better than it was when the cost of production was higher and the commodity cost more. Does the commercial care if the trend continues and prices go lower? No. If prices go lower they have not lost money, as they buy to take delivery. The fact prices decline has no bearing on the excess profits they will make from their purchases, as their profits come from the mark up on the product they make from the commodity. If prices go lower they will want to buy more. What all commercial producers would like to see is a product cost of zero, and then all they would have to worry about is the cost of production – the cost of turning wheat into bread for example. I prefer using weekly charts for several reasons: we get the information once a week, not on a daily time-frame. There is less data to follow. Monthly charts are often late in telling us when the commercial traders have gone heavily long or short. Understanding the COT Report Small Speculators COT Report – I ignore the small speculators COT report. There is some logic to this. As I mentioned earlier, the COT information is about a week late and lags behind what the small traders are doing. There is a belief the small speculators is “always wrong”. I do not believe this is always the case. However, they are wrong at critical turning points; often holding large positions at tops and bottoms (Figures 1 and 2). The COT charts featured in this article is the net difference between the long and short positions the categories of traders are holding. In other words, we take the number of long contracts they have and subtract the total number of short contracts. By doing this, we arrive at the “net position,” that will be net long or net short. The horizontal line represents when buying and selling totals are equal: the commercials for example have the same number of longs as they do shorts. When the net position is above the zero line, the large commercials for example have more longs than shorts; when it is below this line they have more sales on than they do long positions. Let us look at two examples of the small speculators position in Live Cattle and Lean Hogs. Figure 1: Live Cattle December 2006 Weekly Futures Chart. Here is the position of the small
speculators showing that they were opposite to the futures price trend at critical turning
points.
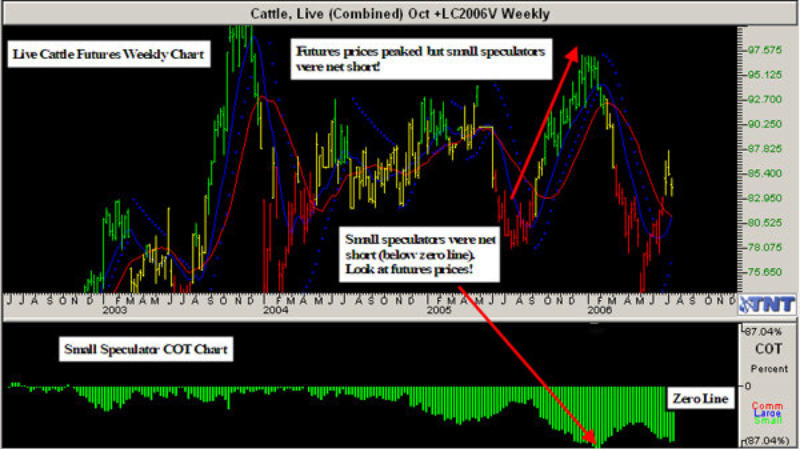
Live Cattle – In November 2003, April 2005 and January 2006, Live Cattle weekly futures
prices had peaked (Figure 1). The small speculators position was at an extreme level but
unfortunately net short. The small traders often go against market trends and have the
attitude of thinking “surely this market cannot go any higher or lower”. Remember picking a
market top or bottom is like jumping out of an aeroplane without a parachute. What are your
chances of survival?
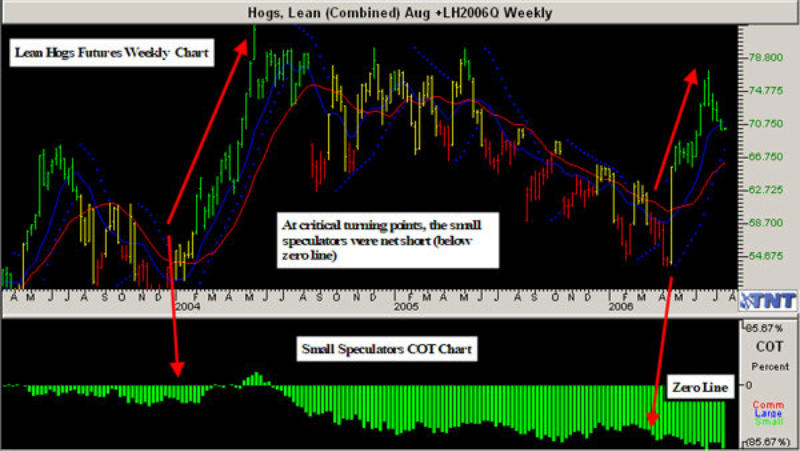
Figure 2: Lean Hogs October 2006 Weekly Futures Chart. Here is the position of the small
speculators showing that they were wrong at critical turning points.
Lean Hogs - In January 2004 and April 2006 (Figure 2), Lean Hogs weekly futures prices
pointed to critical turning points and futures prices were in an uptrend. The small
speculators position was net short and had been for that period even when the market was
sideways.
The small speculators were not wrong in the Live Cattle and Lean Hogs examples because
when future prices turned short there position was still net short. The question we should be
asking is “Were they consistent?” The answer is no and it is because of this inconsistency the
small speculators is the least productive to follow. The fact the COT data is also one week
late further adds weight to this argument.
Non-Commercials (Large Speculators) – They are near
perfect trend followers.
The large traders are mostly commodity fund managers and long-term trend followers. These
fund managers, trade in a particular style and it is that style that highlights their mediocre
performance. Trend followers of this nature simply do not just buy once and wait for the
fireworks. Further, the stronger the trend becomes the more positions trend followers will
have in the market. Let us look at Gold and the 10 Years US Treasury Notes as examples.
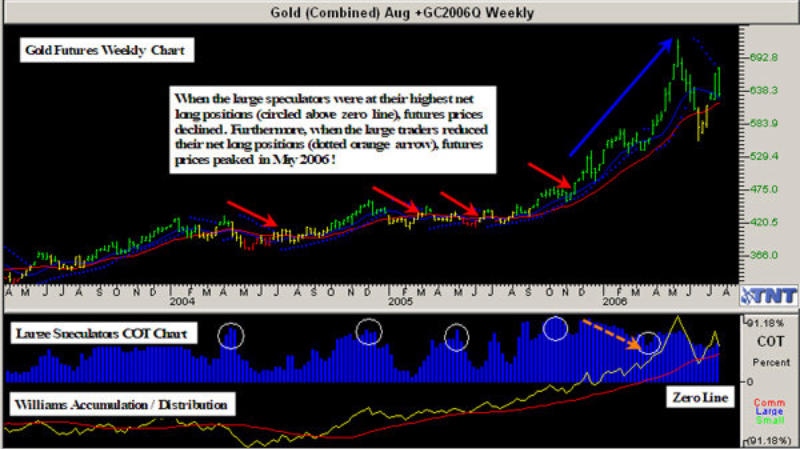
Gold - Figure 3 shows Gold weekly futures chart from May 2003 to July 2006. It is interesting
to see that each time the large traders had their largest long positions, the market declined.
This may surprise some of you. Further, in May 2006, when gold prices peaked, the large
traders were not at their highest net long positions.
I have also included in this chart the Williams Accumulation / Distribution (AD) and its 28
period moving average. Have you noticed how this is more of a reliable indicator than the
large speculators COT chart? There are some traders who prefer the Williams AD indicator to
the large speculators COT chart.
Figure 3: Gold October 2006 Weekly Futures Chart. Here is the position of the large
speculators showing that when the large traders were at their highest net long, the market
declined. The Williams AD shows a closer correlation.
When the net position of the large speculators is at an extreme, expect the market to move
in the opposite direction of the net position of the large speculators. For example, if the
large speculators are net long and the net position is at an extreme and prices have been
moving up, expect the price of the commodity to correct down.
The large traders can and do make money when they catch a trend move, but such strong
trends are rare. There is a greater chance the commercials will be correct.
Remember the COT report shows the number of longs and shorts that is the total position. It
does not tell us when traders entered their positions, only the number of contracts they are
long or short. We know that when a market rallies, more long trades are added. It is only
logical that close to the end of an uptrend, the trend followers will have their most bullish
positions. What is important to recognize is that not all the long trades were placed right at
the end of the trend; the positions were added over the trend move and will naturally be
greater the longer a trend lasts.
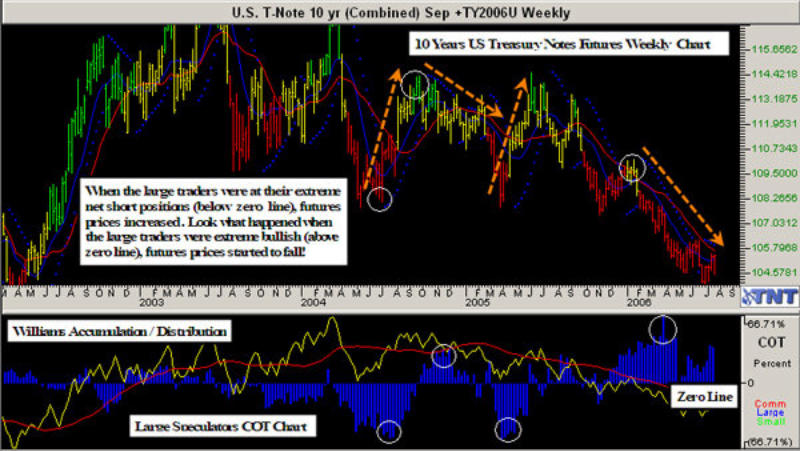
10 Years US Treasury Notes - Figure 4 shows 10 Y ears US Treasury Notes weekly futures price
chart and the net long/short large trader's position from March 2002 to July 2006. On the
chart I have marked off the extremes of their net long/short positions. I have also added the
Williams AD indicator.
It is worth noting that at the best sell points, the large traders had on their largest, most
bullish positions. Further, at the extreme lows the large traders had on their largest short
positions. They were obviously looking for lower prices right at the low. Look what happened
to future s prices . T hey started to increase! Once again the Williams AD indicator appears a
more consistent indicator to follow.
Figure 4: 10 Years US Treasury Notes September 2006 Weekly Futures Chart. Here is the
position of the large speculators showing that at the extremes net long and short positions,
future s prices moved lower and higher respectively. The Williams AD again shows a closer
correlation.
COT Commercials – This is my favourite application of the COT. It is useful in spotting
intermediate to longer term trade set-ups. Why? If you understand what the COT
commercials number means, you will be able to find trade set-ups with large moves. This
should be used with other tools to time our entry and I will explain this later.
I only use the COT commercials in certain markets. They work best in markets that “walk on
the ground (for example live cattle) or come out of the ground (for example crude oil)”.
The commercials tend to move in the opposite direction of the market. When prices are
increasing, the commercials will usually be declining and conversely. They do not use the
markets for speculation but to buy and sell products they need accordingly.
The examples I have featured in this article show that each time the commercial's buying
exceeded their selling and the net position was above the zero line, a market rally was
imminent. The question we need to answer is how can a market rally when so many
commercials are selling following their net long positions ? Remember they are selling
products they own. Unlike speculators, they are not trying to make money from the market
by selling short; in fact they are selling what they own to the market place. Commercials
after all are hedgers and are usually selling. It is unusual for them to be long over time.
It makes logical sense to have a negative COT commercials number (below zero line) and
suggests they are merely doing their job. A positive COT number signals they are net long
because they need the product or because they are accumulating the product to fill futures
orders from their end-users.
If the commercials are net long, you can expect the market to turn higher at some point in
the future. However, it is critical as part of your trading plan to use a timing trigger to go
long because the commercials can stay in losing positions for a long-time as they average
down their cost. Unless you have deep pockets, this is a risky strategy.
To heighten the benefits of the COT commercials charts, we need to look for extreme levels
of bullishness or bearishness to help us identify trade set-ups to go long or short. Let us look
at a few examples.
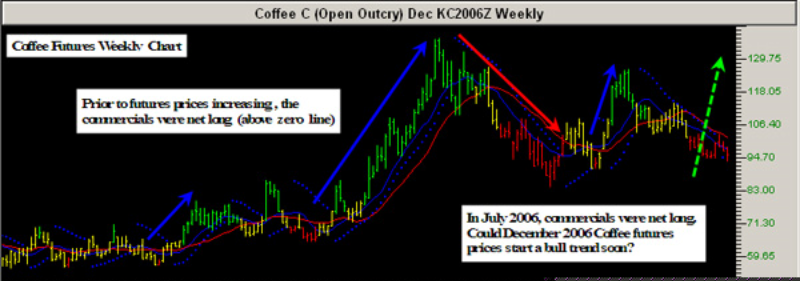
Coffee – Figure 5 shows Coffee weekly futures chart from April 2003 to July 2006.
Figure 5: Coffee December 2006 Weekly Futures Chart. Here is the position of the
commercials showing that before the Coffee bull market, COT commercials had been net
long.
The chart shows that once the COT commercials were net long (above zero line); it was only
a question of time before futures prices started to increase. Further, when the commercials
level was extremely bearish (net short), futures prices started to decrease. This should have
been a signal to lock in profits if you were long before this. In July 2006, the COT
commercials had been net long; this could suggest that Coffee futures prices may increase
soon.
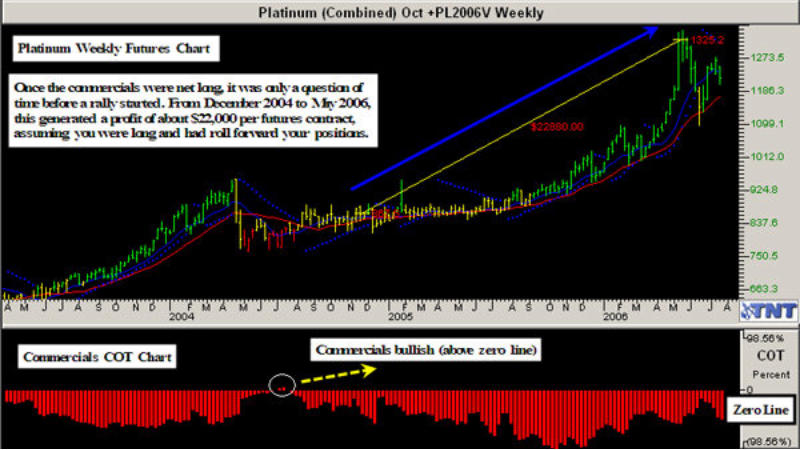
Platinum - Figure 6 shows Platinum weekly futures chart from April 2003 to July 2006.
Figure 6: Platinum October 2006 Weekly Futures Chart. Here is the position of the
commercials showing that before the Platinum bull market, the commercials were net long.
The chart shows the commercials were net long (above zero line) in July 2004. A few months
later, there was a huge bull run that lasted for about two years. This equated to
approximately $23,800 in profits per futures contract, assuming you had roll forward your
positions. This is another example of how we can use the COT commercials data to spot a
potential long trade set-up.
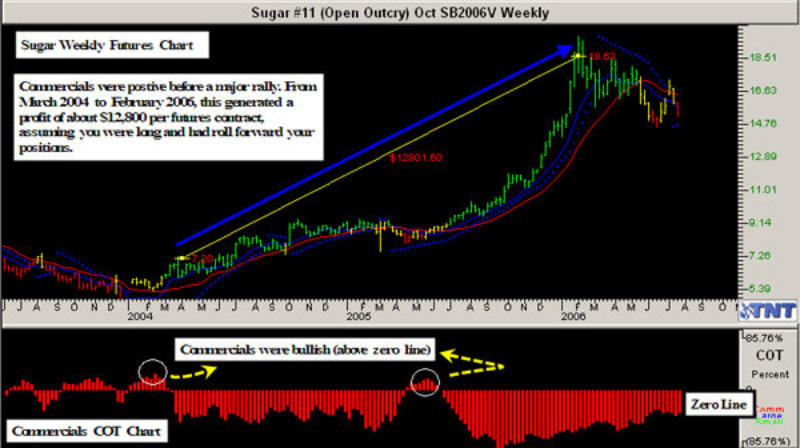
Sugar - Figure 7 shows Sugar weekly futures chart from July 2003 to July 2006
Figure 7: Sugar October 2006 Weekly Futures Chart. Here is the position of the commercials
showing that before the Sugar bull market, the commercials were net long.
Sugar has been in a bull market since 2004 and had almost breached the 20 cents per pound
level in February 2006. Before this bull run, the commercials were net long in early 2004
signalling that it was only a matter of time before the sugar market would offer a potential
long trade set-up. If you had taken advantage of this situation and had roll forward your
positions, the profits per futures contract would have been about $14,400!
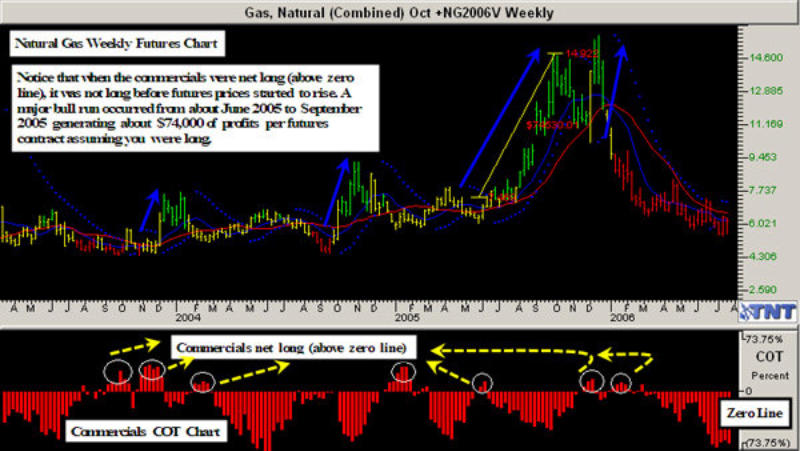
Natural Gas - Figure 8 shows Natural Gas weekly futures chart from April 2003 to July 2006
Figure 8: Natural Gas October 2006 Weekly Futures Chart. Here is the position of the
commercials showing that before the Natural Gas bull market, the commercials were net
long on several occasions.
Natural Gas had been on a huge bull from June 2005 to October 2005 producing profits per
futures contract of about $70,000. Notice how prior to futures prices increasing, the
commercials were bullish.
Timing Trigger
We have seen through various examples how the COT commercials can alert us to a major
bull market well ahead of time. However, if we buy just because the commercials are buying
or if we sell just because they are selling, we are playing with fire. We need to use a trigger
to position our trades based on analysis of the COT commercials data. Commercials are often
on the long side of the market before a major rally begins and they often move to a negative
(hedged) position once the rally begins. Moving to a negative position does not suggest the
bull move is over. In fact, it often confirms the continuation of a bull rally. The fact the
commercials are adding to their hedge position on a scale up as prices rise does not change
the course of the bull market.
One of the triggers that I use with the COT commercials is the Williams Accumulation /
Distribution (AD) and its 28 period moving average MA. Let us look at Crude Oil as an
example.
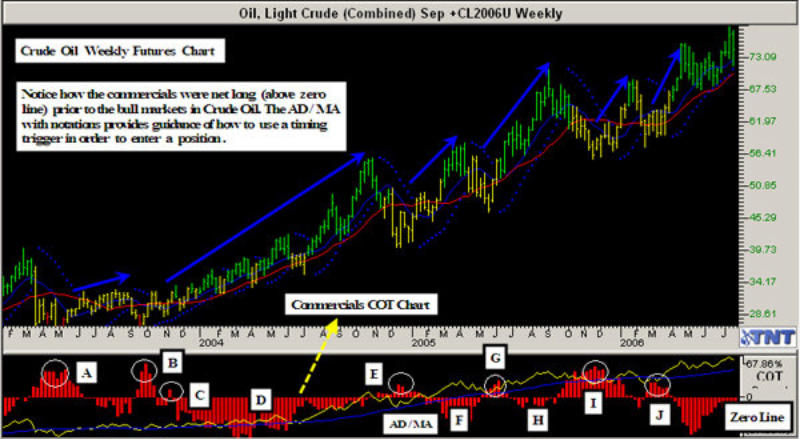
Figure 9 shows Crude Oil weekly futures chart from April 2003 to July 2006. I have marked
the positions where the COT commercials were net long (above zero line). Once this occurred
it was only a matter of time before futures prices started to increase. I have also included
the Williams AD/MA to provide a timing trigger.
Figure 9: Crude Oil September 2006 Weekly Futures Chart. Here is the position of the
commercials showing that before the Crude Oil bull market, the commercials were net long
on several occasions. The AD/MA is included on this chart.
At point “A” COT was above zero line (net long) and AD was below the MA showing possible
weakness. At “B” and “C” COT was positive and AD was above MA suggesting a BUY for
intermediate term. At “D” COT becomes negative, but AD/MA remains positive suggesting the
bull market should continue. At “E” COT becomes positive and AD was above the MA pointing
to a possible long entry into the market. At “F” COT becomes net short but once again AD
was above MA signalling that futures prices should continue to rise. At “G” the commercials
were net long and AD was above the MA highlighting another possible entry point. At “H” COT
was negative but AD was again above MA marking the bull run should continue. At “I” COT
commercials was net long but the AD was below the MA suggesting possible weakness. At “J”
the COT turned positive and the AD was above the MA inferring futures prices may increase
(as was the case).
General Rules :
To achieve success, I include these rules as part of the timing trigger within my trading plan:
• Use a weekly chart of the COT commercials with a Williams Accumulation / Distribution and
its 28 period MA (AD/MA).
• If commercials COT are above the zero line (net long) then check the Williams AD/MA. If
the AD is above its MA, then there is a potential to go long.
• If commercials COT is positive and AD/MA is not, then wait for AD/MA to turn positive
before entering long. However, if the COT turns negative then it must turn positive again
before AD/MA can trigger a potential entry.
• If commercials COT is positive and AD/MA is positive, and either of the two turns negative,
then there is no change in the expectation the bull trend will likely to continue.
• If commercials COT is positive and AD/MA is positive and both turn negative then the
chances are the up trend might not continue. If you are long, use a trailing stop to lock in
any profits.
• If commercials COT is positive and then turns negative this does not mean the up trend
(assuming there is one) is going to end. On the contrary, on many occasions it suggests the
opposite.
• In any trade it is important to use risk management techniques. Never risk more than 3% to
5% of your trading capital. A trade may turn sour but the key is to have enough funds to
fight another day.
Finally
We have seen the usefulness and drawbacks of the COT reports. The reports are an
intermediate to long-term indicator and not the crown of market indicators. However, it does
often give us valuable information about a potential change in trend to futures prices, as
well as the possibility of a continuation of a trend. It is most useful for spotting potential
bullish trends as opposed to bearish trends. As I mentioned in this article, the preference to
follow a particular category be it the large speculators, commercials or small speculators is
dependent on an individuals reasoning.
I have shown through various examples why the smart traders should follow the commercials.
Once they are net long, it is often a trigger that a change in trend to the upside in futures
prices is likely, and this is only a matter of time. To take advantage of this position it is
important to use a timing trigger and my preference is the Williams Accumulation /
Distribution and its 28 period moving average.
As financial expert Todd Buchholz once said, “The point of investing is not to guess the
future, but to act on new information before the whole world pounces on the idea.” The COT
commercials report is powerful only if interpreted correctly and should give you a
competitive advantage over many other traders.
To find out more about the COT tools I used in this article, visit Gecko Software online at:
www.TracknTrade.com
Figure 1: Live Cattle December 2006 Weekly Futures Chart. Here is the position of the small
speculators showing that they were opposite to the futures price trend at critical turning
points.
Live Cattle – In November 2003, April 2005 and January 2006, Live Cattle weekly futures
prices had peaked (Figure 1). The small speculators position was at an extreme level but
unfortunately net short. The small traders often go against market trends and have the
attitude of thinking “surely this market cannot go any higher or lower”. Remember picking a
market top or bottom is like jumping out of an aeroplane without a parachute. What are your
chances of survival?
Figure 2: Lean Hogs October 2006 Weekly Futures Chart. Here is the position of the small
speculators showing that they were wrong at critical turning points.
Lean Hogs - In January 2004 and April 2006 (Figure 2), Lean Hogs weekly futures prices
pointed to critical turning points and futures prices were in an uptrend. The small
speculators position was net short and had been for that period even when the market was
sideways.
The small speculators were not wrong in the Live Cattle and Lean Hogs examples because
when future prices turned short there position was still net short. The question we should be
asking is “Were they consistent?” The answer is no and it is because of this inconsistency the
small speculators is the least productive to follow. The fact the COT data is also one week
late further adds weight to this argument.
Non-Commercials (Large Speculators) – They are near
perfect trend followers.
The large traders are mostly commodity fund managers and long-term trend followers. These
fund managers, trade in a particular style and it is that style that highlights their mediocre
performance. Trend followers of this nature simply do not just buy once and wait for the
fireworks. Further, the stronger the trend becomes the more positions trend followers will
have in the market. Let us look at Gold and the 10 Years US Treasury Notes as examples.
Gold - Figure 3 shows Gold weekly futures chart from May 2003 to July 2006. It is interesting
to see that each time the large traders had their largest long positions, the market declined.
This may surprise some of you. Further, in May 2006, when gold prices peaked, the large
traders were not at their highest net long positions.
I have also included in this chart the Williams Accumulation / Distribution (AD) and its 28
period moving average. Have you noticed how this is more of a reliable indicator than the
large speculators COT chart? There are some traders who prefer the Williams AD indicator to
the large speculators COT chart.
Figure 3: Gold October 2006 Weekly Futures Chart. Here is the position of the large
speculators showing that when the large traders were at their highest net long, the market
declined. The Williams AD shows a closer correlation.
When the net position of the large speculators is at an extreme, expect the market to move
in the opposite direction of the net position of the large speculators. For example, if the
large speculators are net long and the net position is at an extreme and prices have been
moving up, expect the price of the commodity to correct down.
The large traders can and do make money when they catch a trend move, but such strong
trends are rare. There is a greater chance the commercials will be correct.
Remember the COT report shows the number of longs and shorts that is the total position. It
does not tell us when traders entered their positions, only the number of contracts they are
long or short. We know that when a market rallies, more long trades are added. It is only
logical that close to the end of an uptrend, the trend followers will have their most bullish
positions. What is important to recognize is that not all the long trades were placed right at
the end of the trend; the positions were added over the trend move and will naturally be
greater the longer a trend lasts.
10 Years US Treasury Notes - Figure 4 shows 10 Y ears US Treasury Notes weekly futures price
chart and the net long/short large trader's position from March 2002 to July 2006. On the
chart I have marked off the extremes of their net long/short positions. I have also added the
Williams AD indicator.
It is worth noting that at the best sell points, the large traders had on their largest, most
bullish positions. Further, at the extreme lows the large traders had on their largest short
positions. They were obviously looking for lower prices right at the low. Look what happened
to future s prices . T hey started to increase! Once again the Williams AD indicator appears a
more consistent indicator to follow.
Figure 4: 10 Years US Treasury Notes September 2006 Weekly Futures Chart. Here is the
position of the large speculators showing that at the extremes net long and short positions,
future s prices moved lower and higher respectively. The Williams AD again shows a closer
correlation.
COT Commercials – This is my favourite application of the COT. It is useful in spotting
intermediate to longer term trade set-ups. Why? If you understand what the COT
commercials number means, you will be able to find trade set-ups with large moves. This
should be used with other tools to time our entry and I will explain this later.
I only use the COT commercials in certain markets. They work best in markets that “walk on
the ground (for example live cattle) or come out of the ground (for example crude oil)”.
The commercials tend to move in the opposite direction of the market. When prices are
increasing, the commercials will usually be declining and conversely. They do not use the
markets for speculation but to buy and sell products they need accordingly.
The examples I have featured in this article show that each time the commercial's buying
exceeded their selling and the net position was above the zero line, a market rally was
imminent. The question we need to answer is how can a market rally when so many
commercials are selling following their net long positions ? Remember they are selling
products they own. Unlike speculators, they are not trying to make money from the market
by selling short; in fact they are selling what they own to the market place. Commercials
after all are hedgers and are usually selling. It is unusual for them to be long over time.
It makes logical sense to have a negative COT commercials number (below zero line) and
suggests they are merely doing their job. A positive COT number signals they are net long
because they need the product or because they are accumulating the product to fill futures
orders from their end-users.
If the commercials are net long, you can expect the market to turn higher at some point in
the future. However, it is critical as part of your trading plan to use a timing trigger to go
long because the commercials can stay in losing positions for a long-time as they average
down their cost. Unless you have deep pockets, this is a risky strategy.
To heighten the benefits of the COT commercials charts, we need to look for extreme levels
of bullishness or bearishness to help us identify trade set-ups to go long or short. Let us look
at a few examples.
Coffee – Figure 5 shows Coffee weekly futures chart from April 2003 to July 2006.
Figure 5: Coffee December 2006 Weekly Futures Chart. Here is the position of the
commercials showing that before the Coffee bull market, COT commercials had been net
long.
The chart shows that once the COT commercials were net long (above zero line); it was only
a question of time before futures prices started to increase. Further, when the commercials
level was extremely bearish (net short), futures prices started to decrease. This should have
been a signal to lock in profits if you were long before this. In July 2006, the COT
commercials had been net long; this could suggest that Coffee futures prices may increase
soon.
Platinum - Figure 6 shows Platinum weekly futures chart from April 2003 to July 2006.
Figure 6: Platinum October 2006 Weekly Futures Chart. Here is the position of the
commercials showing that before the Platinum bull market, the commercials were net long.
The chart shows the commercials were net long (above zero line) in July 2004. A few months
later, there was a huge bull run that lasted for about two years. This equated to
approximately $23,800 in profits per futures contract, assuming you had roll forward your
positions. This is another example of how we can use the COT commercials data to spot a
potential long trade set-up.
Sugar - Figure 7 shows Sugar weekly futures chart from July 2003 to July 2006
Figure 7: Sugar October 2006 Weekly Futures Chart. Here is the position of the commercials
showing that before the Sugar bull market, the commercials were net long.
Sugar has been in a bull market since 2004 and had almost breached the 20 cents per pound
level in February 2006. Before this bull run, the commercials were net long in early 2004
signalling that it was only a matter of time before the sugar market would offer a potential
long trade set-up. If you had taken advantage of this situation and had roll forward your
positions, the profits per futures contract would have been about $14,400!
Natural Gas - Figure 8 shows Natural Gas weekly futures chart from April 2003 to July 2006
Figure 8: Natural Gas October 2006 Weekly Futures Chart. Here is the position of the
commercials showing that before the Natural Gas bull market, the commercials were net
long on several occasions.
Natural Gas had been on a huge bull from June 2005 to October 2005 producing profits per
futures contract of about $70,000. Notice how prior to futures prices increasing, the
commercials were bullish.
Timing Trigger
We have seen through various examples how the COT commercials can alert us to a major
bull market well ahead of time. However, if we buy just because the commercials are buying
or if we sell just because they are selling, we are playing with fire. We need to use a trigger
to position our trades based on analysis of the COT commercials data. Commercials are often
on the long side of the market before a major rally begins and they often move to a negative
(hedged) position once the rally begins. Moving to a negative position does not suggest the
bull move is over. In fact, it often confirms the continuation of a bull rally. The fact the
commercials are adding to their hedge position on a scale up as prices rise does not change
the course of the bull market.
One of the triggers that I use with the COT commercials is the Williams Accumulation /
Distribution (AD) and its 28 period moving average MA. Let us look at Crude Oil as an
example.
Figure 9 shows Crude Oil weekly futures chart from April 2003 to July 2006. I have marked
the positions where the COT commercials were net long (above zero line). Once this occurred
it was only a matter of time before futures prices started to increase. I have also included
the Williams AD/MA to provide a timing trigger.
Figure 9: Crude Oil September 2006 Weekly Futures Chart. Here is the position of the
commercials showing that before the Crude Oil bull market, the commercials were net long
on several occasions. The AD/MA is included on this chart.
At point “A” COT was above zero line (net long) and AD was below the MA showing possible
weakness. At “B” and “C” COT was positive and AD was above MA suggesting a BUY for
intermediate term. At “D” COT becomes negative, but AD/MA remains positive suggesting the
bull market should continue. At “E” COT becomes positive and AD was above the MA pointing
to a possible long entry into the market. At “F” COT becomes net short but once again AD
was above MA signalling that futures prices should continue to rise. At “G” the commercials
were net long and AD was above the MA highlighting another possible entry point. At “H” COT
was negative but AD was again above MA marking the bull run should continue. At “I” COT
commercials was net long but the AD was below the MA suggesting possible weakness. At “J”
the COT turned positive and the AD was above the MA inferring futures prices may increase
(as was the case).
General Rules :
To achieve success, I include these rules as part of the timing trigger within my trading plan:
• Use a weekly chart of the COT commercials with a Williams Accumulation / Distribution and
its 28 period MA (AD/MA).
• If commercials COT are above the zero line (net long) then check the Williams AD/MA. If
the AD is above its MA, then there is a potential to go long.
• If commercials COT is positive and AD/MA is not, then wait for AD/MA to turn positive
before entering long. However, if the COT turns negative then it must turn positive again
before AD/MA can trigger a potential entry.
• If commercials COT is positive and AD/MA is positive, and either of the two turns negative,
then there is no change in the expectation the bull trend will likely to continue.
• If commercials COT is positive and AD/MA is positive and both turn negative then the
chances are the up trend might not continue. If you are long, use a trailing stop to lock in
any profits.
• If commercials COT is positive and then turns negative this does not mean the up trend
(assuming there is one) is going to end. On the contrary, on many occasions it suggests the
opposite.
• In any trade it is important to use risk management techniques. Never risk more than 3% to
5% of your trading capital. A trade may turn sour but the key is to have enough funds to
fight another day.
Finally
We have seen the usefulness and drawbacks of the COT reports. The reports are an
intermediate to long-term indicator and not the crown of market indicators. However, it does
often give us valuable information about a potential change in trend to futures prices, as
well as the possibility of a continuation of a trend. It is most useful for spotting potential
bullish trends as opposed to bearish trends. As I mentioned in this article, the preference to
follow a particular category be it the large speculators, commercials or small speculators is
dependent on an individuals reasoning.
I have shown through various examples why the smart traders should follow the commercials.
Once they are net long, it is often a trigger that a change in trend to the upside in futures
prices is likely, and this is only a matter of time. To take advantage of this position it is
important to use a timing trigger and my preference is the Williams Accumulation /
Distribution and its 28 period moving average.
As financial expert Todd Buchholz once said, “The point of investing is not to guess the
future, but to act on new information before the whole world pounces on the idea.” The COT
commercials report is powerful only if interpreted correctly and should give you a
competitive advantage over many other traders.
To find out more about the COT tools I used in this article, visit Gecko Software online at:
www.TracknTrade.com

*Risk Disclosure: Trading security futures contract may not be suitable for all investors. You may lose a substantial amount of money in a very short period of time. The amount you may
lose is potentially unlimited and can exceed the amount you originally deposit with your broker. This is because futures’ trading is highly leveraged, with a relatively small amount of
money used to establish a position in assets that have a much greater value. If you are uncomfortable with this level of risk, you should not trade security futures contracts.
Copyright © All rights reserved : Trade Futures Ltd.
www.TradeFutures.co.uk

Commodity Trading Advisors & Management Consultants
Lean Hogs COT Chart
Dec Live Cattle Weekly Futures
Chart. Here is the position of the
small speculators showing that they
were opposite to the futures price
trend at critical turning points.
See a closer look in my article at this
trade scenario.

Look At These Trends
In Kansas City Wheat!
October Gold Weekly Futures Chart.
Here is the position of the large
speculators showing that when the
large traders were at their highest
net long, the market declined.
See a closer look in my article at
this trade scenario.